Article Contents
- 1. Build your high-frequency spare database
- 2. Frequency and conversion rates in training
- 3. Reflection and next steps with a spare shooting journal
- 4. Data collection this season
- 5. Advanced analysis
- 6. Alternative/multiple spare shooting strategies for the same leave
- 7. Concluding remarks
Note: This article is only available to Bowling This Month subscribers.
At one of my recent clinics, I asked the participants to share with me their 13th most frequent spare leave. Stunned by the question, there was absolute silence. After a quick pause, I asked them if it would be valuable to know their unique top 25 most frequent spare leaves and subsequent conversion rates of each. Everyone shook their head and smiled with recognition of the novel idea.
Developing an in-depth awareness of your unique spare shooting strengths and weaknesses is one of the easiest ways to improve your overall scores and scoring consistency. As bowlers move into the 2018-19 season, I recommend completing and maintaining an ongoing analysis of your unique and individualized high-frequency spare leaves and subsequent conversion rates. What better way to gain objective insights into your unique spare shooting strengths and weaknesses? Data analysis reveals the truth, and with objective truth comes the opportunity to inform one’s practice plans.
In this article, I discuss a process of building an ongoing database of your most frequent spare leaves and subsequent conversion rates. This process will take your game to a higher level, as it offers a blueprint for targeting spare shooting weaknesses that contribute most to your scoring and consistency.
Build your high-frequency spare database
Before the start of the upcoming season, review the data from last season’s competitions and leagues on your bowling scoring application. Review and rank-order both single-pin and multi-pin spares. Specifically, rank-order your top 25 spare leaves by highest leave frequency. Remove the rarely-made splits—such as the 7/10 and 4/6—from your list and replace them with the next spare leave to ensure the focus is on the top 25 makeable high-frequency leaves. When this data collection is complete, build a spreadsheet as described below. This will provide the opportunity to complete a foundational analysis from which you will have an initial assessment of strengths and weaknesses.
Begin by entering the four column titles shown below, repeating them twice to make an eight-column sheet. It should look something like this:

Create a spreadsheet, with column headings as shown (left). Duplicate the first four columns to make an eight-column spreadsheet.
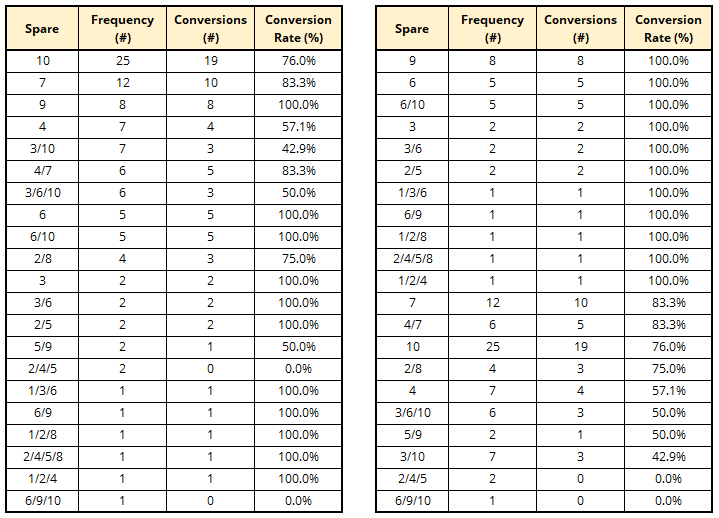
Enter your top 25 data in column 1 (spare), column 2 (frequency), column 3 (number of conversions), and column 4 (conversion percentage). After entering the data, copy and paste the values into the four additional columns.
On the first four columns, sort based on frequency, with a secondary sort on conversion percentage. This will allow for a quick review of your most frequent spare leaves and conversion rates. Sort the second four columns by conversion percentage, with a secondary sort on frequency. The end product should look something like this:

High-frequency spare database, sorted by frequency (left) and sorted by conversion rate (right)
Once the data is sorted, the first half (the first four columns) will be a high-frequency spare tally chart, while the second half (the last four columns) will provide a conversion rate tally. Review the data in full and reflect on both the ...
Already a premium member? Click here to log in.


